YCharts
Backtest your trading strategies, generate potential strategies, and analyze years of data from the world's financial markets

- Category Vertical Industry Software
- Languages English
An efficient financial data platform offering comprehensive analysis tools.
Overview
yCharts is a premier financial data platform that aims to simplify finance with its comprehensive suite of data analysis tools. This software is designed to provide users with an in-depth understanding of market trends and financial data, enabling them to make informed investment decisions.
Features
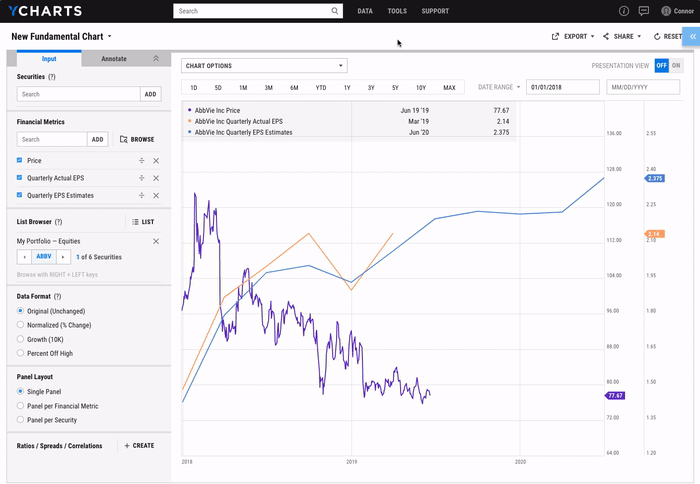
yCharts is packed with features designed to provide users a deep understanding of financial data. It includes over 1 million economic indicators and allows users to access historical market data. With its robust visualization tools, users can create dynamic charts and graphs to better understand and present their data.
One of the standout features of yCharts is the Excel Add-in. This allows users to pull data directly into Excel for further analysis. The software also provides an extensive library of pre-built templates and reports, saving users valuable time.
Performance
yCharts is renowned for its high-speed performance. Data retrieval is quick and seamless, allowing users to access the information they need without any delays. This makes it an excellent tool for financial professionals who require real-time data for their work.
The software's interface is user-friendly and intuitive, making it accessible even to those with minimal technical experience. Users can easily navigate through the platform and locate the data they need with just a few clicks.
Support
yCharts offers extensive support to its users. From a comprehensive FAQ section to a dedicated customer support team, users can get assistance whenever they encounter issues with the software. The support team is known for its prompt response and helpful solutions.
Conclusion
In conclusion, yCharts is a versatile and efficient financial data platform. Its extensive features, high-speed performance, and excellent support make it a reliable tool for any financial professional. Whether one is looking to analyze historical market trends or create dynamic data visualizations, yCharts is the software to rely on. It simplifies finance and enables users to make informed investment decisions, making it a worthy addition to any professional's toolkit.
Highest-Rated Features:
- Charting
- Financial Analysis
- Risk Analysis
Lowest-Rated Features:
- Market News
- Market Information
- Alerts and Monitoring


- Company
- YCharts, Inc.
- HQ Location
- Chicago, IL
- Year Founded
- 2009
- LinkedIn® Page
- https://www.linkedin.com/company/601625 (100 employees)